Introduction
Vastus medialis muscle (VM) plays a critical role in the functional stability of the patellofemoral joint (PFJ), which is mainly based on the counterstrain for vastus lateralis torques and optimizing patellar tracking within the trochlear groove [1]. There are various clinical conditions that contribute to the impairment of the VM, which, without an appropriate diagnosis and treatment approach, may end up with the chronic inhibition of this muscle unit and finally result in PFJ dysfunction [2]. It has been shown that in patients with knee osteoarthritis, VM degeneration is associated with cartilage loss and worsening PFJ symptoms [3,4]. VM atrophy was also found in people with patellofemoral pain syndrome (PFPS) when compared to an asymptomatic population [5,6]. Additionally, preoperative VM thickness measurement can predict the development of postoperative PFPS in patients after arthroscopic partial meniscectomy [7]. After anterior cruciate ligament (ACL) reconstruction, some patients experience activation failure and reduced ability of the VM to contract. This condition, known as arthrogenic muscle inhibition (AMI), refers to a neural inhibition of the quadriceps femoris muscle [8,9]. Although its exact mechanisms are not fully understood, AMI is generally thought to result from abnormal sensory input originating from a post-operation knee joint [10]. This altered input disrupts normal motor control and can negatively affect both short- and long-term postsurgical outcomes [11,12]. In chronic conditions, prolonged AMI contributes to changes in muscle architecture [13], disturbances in muscle growth and strength gains [14], and can ultimately delay the desired recovery time [15]. Considering the aforementioned studies, it seems that early diagnosis of VM dysfunction may be critical in various clinical conditions and presents a significant challenge for clinicians. Ultrasound (US) imaging for muscle assessment has gained prominence in musculoskeletal research and clinical practice, demonstrating its use across diverse populations and conditions [16-19]. According to sonographic VM measurement, its thickness is considered as valid and reliable as magnetic resonance imaging (MRI) and serves as an objective tool for VM assessment [20,21]. Evaluation of VM function with the use of US typically involves three metrics: cross-sectional thickness [22], cross-sectional area (CSA) [21], and pennation angle [23].
Aim of the work
This study aimed to determine whether VM thickness in the longitudinal section is a reliable measure and can be used as an additional metric. We evaluated intra-rater measurement reliability, with US measurements taken during two sessions and a third taken after a one-week interval by an examiner with a low level of experience in sonographic musculoskeletal assessment.
Material and methods
This descriptive laboratory study assessed the intra-rater reliability of VM thickness measurements in healthy participants. Measurements included VM thickness at rest (R) and during maximal voluntary isometric contraction (MVIC). Three sessions were conducted: two on the first day with a 5-minute break and the third after a one-week interval. The examiner underwent basic training from an experienced US specialist prior to the study.
18 healthy participants (3 males) completed the study, with a mean age of 23.5±1.25 years, height 1.71±0.11 m, weight 67.5±15.57 kg, and BMI 22.83±3.24. Based on previous reliability studies of quadriceps US [22], a minimum of 16 participants was sufficient to obtain stable intra-class correlation coefficients (ICC) values. Inclusion required participants to be 18 y.o. or older, and the exclusion criteria were: history of lower extremity surgery, neurological disorders, and current pain/injury in the past month. VM images were collected during R and MVIC using a DP 6600 US device (Mindray, Shenzhen, China) with a 38 mm linear-array probe (5-10 MHz). The scanner settings were standardized across all measurements: depth 4 cm, a single focal zone positioned at the mid-belly of the vastus medialis (~2 cm below the skin surface), overall gain 50%, and dynamic range 70 dB. The reference point was 80% of the distance between the anterior superior iliac spine and the joint space (medial tibiofemoral joint line, which was identified by palpation) [24]. To ensure consistent knee positioning at 15° flexion, a foam roller and straps stabilized the leg, and the US probe was secured with elastic tape for repeatability. Generous US gel was used to minimize tissue compression.
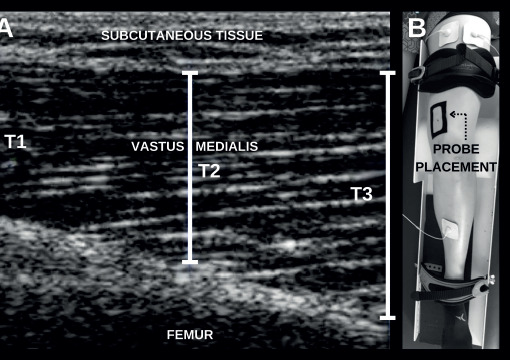
The quadriceps femoris MVICs were performed in a standardized supine position against a fixed resistance. Each contraction was maintained for 5 seconds, followed by 60 seconds of rest to avoid fatigue. During each session, six MVIC trials were performed, yielding six US images during contraction and six at rest (12 images per session, 36 images per participant in total). Surface electromyography (sEMG) with electrodes placed on the quadriceps femoris provided real-time visual feedback to ensure stable contractions. The trial images were blinded before analysis. VM thickness was measured at three points (left edge, right edge, midpoint) per image, and the mean value was used for further analysis. Thickness measurement and the lower extremity position during image registration is presented in Figure 1.
Figure 1
Panel A: US image showing VM thickness key measurement points: T1 (left edge), T2 (midpoint), and T3 (right edge), with marked subcutaneous tissue and femur bone; Panel B: Probe placement setup at the standardized reference point on the participant’s thigh
ICCs were calculated using a mixed-model ANOVA. ICC (3, k) values assessed intra-rater reliability over repeated sessions on the same day (intra-rater 1) and after a one-week interval (intra-rater 2). Reliability was classified as poor (<0.5), moderate (0.5-0.75), good (0.75-0.9), or excellent (>0.9) [25]. Confidence intervals (95% CI), the standard errors of measurement (SEM = SD × (1 − ICC)½) and the smallest detectable differences (SDD = SEM × 1.96 × 2½) were calculated using Statistica (Version 13; TIBCO Software Inc., Palo Alto, CA, USA) and SPSS (IBM Corp., Armonk, NY, USA) software. Two same-day sessions assessed short-term repeatability, while the third session (one week later) assessed test-retest reliability over time.
Results
For intra-rater 1 reliability at VM R conditions, the ICCs ranged from 0.93 (95% CI: 0.84-0.97) for a single registration to 0.98 (95% CI: 0.94-0.99) when averaging up to six registrations. The corresponding SEM and SDD values decreased from 1.1 mm for a single registration to 0.6 mm for six registrations and from 3.0 mm to 1.6 mm, respectively. Under VM MVIC conditions, intra-rater 1 reliability demonstrated high ICC values, ranging from 0.93 (95% CI: 0.82-0.97) for a single registration to 0.98 (95% CI: 0.94-0.99) with six registrations. The SEM and SDD values decreased from 1.3 mm for a single registration to 0.7 mm for six registrations, and from 3.6 mm to 1.8 mm, respectively. For intra-rater 2 reliability at VM R, the ICCs were lower, starting at 0.52 (95% CI: 0.09-0.79) for a single registration and improving to 0.81 (95% CI: 0.49-0.93) with six registrations. Similarly, the SEM and SDD values decreased from 2.8 mm for a single registration to 1.8 mm for six registrations, and from 7.9 mm to 5.1 mm, respectively. For intra-rater 2 reliability under VM MVIC, ICCs started at 0.74 (95% CI: 0.44-0.89) for a single registration and increased to 0.87 (95% CI: 0.67-0.95) with six registrations. Corresponding SEM and SDD values improved from 2.5 mm to 1.8 mm and 7.1 mm to 4.9 mm, respectively. All the ICC values, SEMs, and SDDs are summarized in Table 1.
Table 1
ICCs with 95% CIs, SEMs, and SDDs for VM thickness measurement at rest and during MVIC
[i] Notes: Reliability is presented separately for two raters: Intra-rater 1 (repeated measurements within the same day) and Intra-rater 2 (measurements repeated after a one-week interval). The column “N registrations” indicates the number of US images averaged to calculate each value. ICC – intraclass correlation coefficient, SDD – smallest detectable differences, SEM – standard errors of measurement.
The mean registered VM thickness at rest was 27.1 mm (±3.9), increasing to 32.4 mm (±4.6) during MVIC, with a mean thickness change of 5.3 mm (±2.5). VM thickness results during rest and MVIC for individual participants are presented in Table 2.
Table 2
VM thickness measurement during rest and MVIC for individual participants (mean of all 18 registrations recorded during three sessions of the of the study)
Discussion
This study demonstrates that intra-rater reliability for VM thickness measurements in the longitudinal plane using US depends on the number of registrations and measurement conditions. Intra-rater 1 reliability showed consistently excellent ICC values (≥0.93) for both R and MVIC conditions, indicating strong reliability for same-session measurements. In contrast, intra-rater 2 reliability was lower, particularly for single registrations, highlighting the challenges of reproducing VM thickness measurements over a one-week interval. ICC values for R measurements ranged from moderate (0.52) to good (0.81), suggesting variability due to probe positioning, participant differences, and examiner experience. However, averaging registrations significantly improved reliability (ICC up to 0.87), emphasizing the importance of careful methodological approaches. These findings are consistent with prior research; Koen et al. found good test-retest reliability of VM thickness across knee flexion angles [23]. Worsley et al. validated US against MRI for distal VM fibers, demonstrating high correlations (ICC: 0.84-0.94) and strong associations between thickness and CSA (r=0.87) [20]. Taniguchi et al. found better US-MRI correlations for VM thickness in the sitting position [4], while Minnehan et al. demonstrated excellent US-MRI agreement for VM CSA (ICC: 0.980-0.997) [21]. Cheon et al. showed moderate-to-high inter-rater reliability for VM thickness (ICC: 0.62-0.90) [26], further supporting the validity of US for VM assessments. Accurate VM thickness assessment is clinically relevant for conditions such as PFPS, knee osteoarthritis, and post-surgical quadriceps dysfunction. High intra-rater reliability underscores the utility of US in VM evaluation, with multiple measurements enhancing diagnostic accuracy, and despite lower intra-rater 2 reliability, averaging ensured acceptable reliability, highlighting the need for consistent landmarks, standardized protocols, and examiner training for effective long-term clinical monitoring.
This study has several limitations. The small sample of healthy participants (83% females) limits generalizability to clinical populations. Future studies should investigate both genders in balanced groups and extend the research to various populations (e.g. patients with PFPS, knee OA, and post-ACL reconstruction). Additionally, the limited sonographic experience of the examiner may have influenced reliability, suggesting the need to investigate the effects of examiner expertise and the potential benefits of advanced training programs. Future studies should investigate reliability across different levels of clinical experience, explore automation-assisted US techniques, and assess the utility of VM thickness measurements in monitoring treatment outcomes.
Conclusions
In conclusion, VM thickness measurements using US imaging in the longitudinal plane are highly reliable within a single session, particularly when multiple registrations are averaged. Although reliability decreases over a one-week interval, repeated measurements can improve consistency. For progress monitoring in clinical practice, at least 3-4 images should be averaged, and changes smaller than ~5-8 mm (depending on conditions and number of images) should be interpreted with caution. These findings support using US as a reliable tool for assessing VM thickness in the longitudinal plane in clinical and research settings.
Disclosures and acknowledgements
The authors declare no conflicts of interest with respect to the research, authorship, and/or publication of this article.
This research received no specific grant from any funding agency in the public, commercial, or not-for-profit sectors.
The study received the ethical approval (the approval number: 2017/3) from the Research Ethics Committee at Academy of Physical Education, Katowice, Poland. The recruitment took place between March 2017 and May 2021. All the participants were provided with the written informed consent. The Declaration of Helsinki was followed in the conduct of the study.
Artificial intelligence software (Grammarly, Inc., San Francisco, CA, USA) was utilized only for the grammar and vocabulary correction during the initial preparation of the article draft and did not generate scientific content.