Introduction
Empathy toward individuals with mobility impairments, including wheelchair users, is crucial for shaping effective public policies and educational programs [1-3]. Despite continuous efforts to promote inclusion, these individuals still encounter various barriers that limit full social participation [4-6]. Therefore, research on empathy should employ validated instruments that adequately reflect contemporary sociopolitical conditions [3,4]. Empathy – understood as the ability to recognize and resonate with another person’s emotional or physical state, affects both the perception of needs and the effectiveness of support. It is thus an individual competence as well as a prerequisite for enhancing the quality of life and social participation of people with disabilities [5].
Central and Eastern Europe (CEE) has undergone diverse sociopolitical transitions that directly shape attitudes toward disability and wheelchair users. Although research on disability inclusion is expanding, cross-national comparative studies of empathy toward wheelchair users remain limited, especially those addressing individual contact experiences and macro-contextual influences (e.g. wartime exposure or prevailing cultural norms).
In the CEE, the implementation of inclusive policies generally progresses more slowly than in Western Europe [6-9]. Deep-seated stereotypes persist alongside emerging integration initiatives. Among younger adults, tolerance for diversity remains below the EU average, and limited knowledge about disabilities is often associated with reduced empathy toward individuals with mobility impairments (IMI) [7,10]. Systematic monitoring and fostering of empathy are therefore crucial for both regional strategies and global inclusion agendas [3,5,11]. Empathy levels may serve as indicators of moral and cultural development, social cohesion, and a society’s overall capacity for diversity and inclusion.
The current geopolitical situation, including the COVID-19 pandemic and the ongoing Russo-Ukrainian war, further underscores the importance of studying inclusion and support systems for people with disabilities [12-14]. Prolonged crises can enhance social engagement on behalf of vulnerable groups, driven by heightened awareness, stronger solidarity, and accumulated experience of living under risk and uncertainty [15,16].
University students, as future social and professional leaders, have potential to foster inclusion through their values and actions, thereby impacting institutional and public policy frameworks [17-19]. Sustaining these changes requires a deep understanding of the needs of the wider academic community (beyond medical faculties) and the consistent implementation and evaluation of anti-discrimination mechanisms [3,7].
Across the eastern and western borders of the EU, the legal, social, institutional, and cultural frameworks affecting individuals with mobility impairments have evolved along distinct trajectories. In Lithuania, European integration has strengthened inclusive policies and accessibility monitoring systems, though social and infrastructural barriers remain [20-21]. In Poland, equality-oriented regulations and practices have gradually advanced, yet disparities in accessibility and persistent instances of exclusion remain notable [22-24]. In Belarus, slower progress and limited civic participation have reinforced a custodial-institutional model and sustained accessibility barriers [25,26]. Across post-communist countries, the transition from segregative to rehabilitative and environmental approaches has been evident, accompanied by growing interest in inclusive education, though at an uneven pace and scope [27,28]. Slovakia, similar to neighboring states, is strengthening the framework for equal treatment and civil society development, yet persistent accessibility challenges continue [9,29].
In Ukraine, historical gaps in inclusive education and support services have been magnified by ongoing military actions, resulting in a greater number of individuals with acquired disabilities and growing needs for rehabilitation, prosthetics, and mobility support [15,16]. Simultaneously, increased public visibility of veterans and civilians with disabilities may foster more positive and empathetic attitudes within society and institutions [30-32].
Although research on disability inclusion in the CEE is expanding, comparative empirical studies of university students’ empathy toward wheelchair users remain scarce, particularly those integrating cross-border comparisons between the EU and neighboring non-EU countries while accounting for contemporary crises [33,34]. This lack of evidence highlights the need for systematic analysis of differences and similarities among student populations across the EU’s eastern frontier to inform evidence-based interventions in higher education and public policy.
The present study conducts a cross-national analysis within the CEE, examining how macro-level factors (e.g. the EU membership, exposure to armed conflict) and micro-level characteristics (e.g. frequency and quality of contact with wheelchair users, knowledge, empathy skills) relate to empathy, using validated measurement tools [35-38]. In contrast to most previous research focusing on single-country samples and underestimating interpersonal and contextual factors, this study systematically evaluates how contact and sociopolitical conditions shape empathy toward people with disabilities. We accordingly ground our analysis in the Social Ecological Model (SEM) [39], which conceptualizes individual, interpersonal, organizational, and societal influences as interrelated levels within a single ecological system.
Aim of the work
The aim of this study was to compare empathy levels among university students in Lithuania, Poland, Slovakia, Ukraine, and Belarus toward wheelchair users, and to identify individual and contextual determinants of variation, with particular attention to sociopolitical change (including the ongoing armed conflict in Ukraine), sociodemographic indicators, and patterns of contact with people with disabilities.
Research question: How do empathy profiles toward wheelchair users differ among university students in Lithuania, Poland, Slovakia, Ukraine, and Belarus, and to what extent are these differences explained by the frequency of contact with wheelchair users and macro-contextual factors?
Hypotheses: Empathy toward wheelchair users differs significantly between countries; regular contact with wheelchair users is positively associated with higher empathy scores; and country-level exposure to distinct macro-contextual factors (e.g. the ongoing conflict in Ukraine) corresponds to variations in specific empathy components.
Material and methods
Respondent group and study organization
This study was conducted in 2024-2025 among university students from five countries along the eastern border of the European Union: Poland, Lithuania, Belarus, Ukraine, and Slovakia. To ensure heterogeneity in academic, cultural, and social environments and to enable meaningful cross-cultural comparisons of both micro- and macro-contextual influences, purposeful sampling was employed. The sample comprised students from medical and nonmedical programs, including humanities and pedagogy.
A total of N=4,474 students participated: 494 from Lithuania (LT), 1,099 from Belarus (BY), 988 from Poland (PL), 985 from Ukraine (UA), and 908 from Slovakia (SK). Recruitment involved academic centers in Kaunas and Vilnius (LT); Grodno and Minsk (BY); Kyiv, Ternopil, Ivano-Frankivsk, and Lviv (UA); Białystok, Łomża, Suwałki, and Biała Podlaska (PL); and Prešov, Martin, and Ružomberok (SK).
Recruitment was organized in collaboration with university authorities and student coordinators, using institutional channels (mailing lists and e-learning platforms), as well as departmental social media announcements. Inclusion criteria were: enrollment in undergraduate, graduate, or integrated programs; age ≥18 years; provision of informed consent; and complete response to all questionnaire items. Exclusion criteria were: lack of consent; age <18 years; and missing data.
Data were collected via an anonymous, voluntary online survey. The average completion time was approximately 15 minutes. Participants could withdraw at any stage without providing a reason. The survey process was coordinated and monitored by an international research team. Only fully completed questionnaires were retained for statistical analysis. To ensure data quality, we implemented built-in validation rules and consistency checks, including attention-check items and page-level time constraints.
Sociodemographic and contextual questionnaire
A custom-designed sociodemographic and contextual questionnaire collected data on gender, age, marital status, place of residence, religious affiliation, field and level of study, exposure to disability-related content, and experiences of contact in the past month with individuals who use wheelchairs. Item development was informed by literature review and expert consultation to ensure content validity.
Primary measure of empathy: KRE-II
The principal instrument was the revised standardized Empathic Understanding of Others questionnaire (KRE-II), which conceptualizes empathy as an emotional-cognitive construct with a motivational component. Selection and adaptation of the tool were guided by expert consultations to ensure consistency with the original authors’ intent [38]. Empathy was operationalized to include both affective (empathic concern) and cognitive (perspective-taking) components that collectively shape the perception of others. In this study, empathy is defined (per the KRE-II framework) as the capacity to understand and share another person’s feelings, distinct from sympathy, which is limited to feelings of pity or concern.
Structure and reliability
Factor and reliability analyses identified five subscales (“syndromes”). The 33-item version demonstrated satisfactory internal consistency (Cronbach’s α=0.852 overall; LT=0.864; BY=0.875; PL=0.860; SK=0.837; UA=0.828), indicating good reliability.
Syndrome I: “Sympathizing with others’ pleasant and painful experiences” – sympathy for both positive and negative experiences; sharing analogous experiences may foster emotional intimacy and support.
Syndrome II: “Co-suffering with others’ experiences” – affective resonance with others’ emotions, often described as emotional attunement.
Syndrome III: “Sensitivity to others’ experiences” – attentiveness and receptiveness to emotional signals and the needs of those around us.
Syndrome IV: “Readiness to sacrifice for others” – motivational-behavioral tendency to engage in supportive action.
Syndrome V: “Empathy toward others’ states and experiences” – accurate, focused perception of another individual’s emotional state and perspective.
Distinguishing empathy from sympathy
Differentiating “sympathy” from “empathy” is essential for interpreting subscale profiles. Sympathy is frequently expressed through sharing one’s analogous experiences and can strengthen bonds via perceived commonality; however, it may shift focus toward the sender’s perspective, risking egocentric responses. Empathy, on the other hand, prioritizes a precise understanding of the other person’s experiences and perspectives, centering on that person and on the appropriateness of the support provided. This distinction clarifies why superficially similar behaviors can yield different outcomes for support quality and enables differentiation between affiliative-affective profiles and those characterized by greater perceptual-cognitive precision. These nuances are pertinent to cross-cultural analyses and to understanding the relationship with supportive behaviors.
Instrument adaptation and pilot study
A pilot study (with approximately 15-25 students per country) led to refinements in instructions and item wording in the respective official languages. The adaptation procedure included forward translation by research partners, consensus on initial versions, back-translation, cognitive interviews, verification by independent translators, and team-based resolution of discrepancies. Cognitive debriefing ensured comprehensibility and semantic and functional equivalence across language versions. Pilot analyses also explored associations between sociodemographic variables and empathy levels. To assure data integrity, control procedures included checking for completeness, monitoring response times, and assessing response consistency.
Statistical analysis
Statistical analyses were performed in Statistica 13.0 PL (TIBCO Inc., USA). Prior to main analyses, data quality was verified through logical consistency checks, outlier detection, and assessment of distributional assumptions. Normality was evaluated using the Shapiro-Wilk test. Due to frequent deviations from normality, non-parametric methods were employed for group comparisons.
Descriptive statistics were reported as mean (M), standard deviation (SD), median (Me), minimum, maximum, interquartile range (IQR), and percentages (%). Post hoc power analyses confirmed that with N>4,000, statistical power exceeded 0.99 to detect small-medium between-group differences in empathy scores using Kruskal-Wallis and Mann-Whitney tests at α=0.05.
Two-group differences were examined using the Mann-Whitney U test; comparisons among multiple groups used the Kruskal-Wallis test. Pairwise post hoc comparisons were performed via Dunn’s tests with Benjamini-Hochberg adjustment. Categorical variables were analyzed using Pearson’s χη2 test. Associations between quantitative or ordinal variables were examined using Spearman’s rank correlation (ρ). Statistical significance was set at a two-tailed α=0.05.
In line with study objectives, analyses included: (1) sample description; (2) cross-country and subgroup comparisons using appropriate tests; and (3) analysis of relationships between empathy and individual/contextual factors, such as level of contact with people with disabilities, field of study, and, for the Ukrainian subgroup, indicators of war-related exposure.
Results
Sociodemographic characteristics of the study groups
The demographic and contextual diversity within the sample provides a robust basis for examining how sociodemographic features, prior contact with individuals with disabilities, and broader social contexts relate to empathy levels.
Table 1 summarizes key characteristics by country, including age, gender, residence, marital status, field and level of study, employment, religious affiliation, and frequency of contact with wheelchair users. These variables, alongside self-assessed attitudes toward people with disabilities, enable both cross-national comparison and within-country analyses.
Table 1
Sociodemographic profile and key variables of respondents (n=4,474)
[i] Notes: Post-hoc comparisons were performed using Dunn’s tests with Benjamini-Hochberg adjustment (two-tailed, α=0.05): BY < PL, SK, UA, LT (all p<0.01); LT < PL, SK, UA (all p<0.01); PL > SK, UA (both p<0.01); SK < UA (p<0.01). Abbreviations: LT – Lithuania; BY – Belarus; PL – Poland; SK – Slovakia; UA – Ukraine. Tests: Kruskal-Wallis H, p for continuous/ordinal variables; Pearson’s chi-square χη2, p for categorical variables.
The results obtained from non-parametric tests and tests of independence reveal significant differences between countries across the majority of the analyzed dimensions (p<0.01; p<0.001), corroborated by the statistics from the Kruskal-Wallis test (H) and the chi-squared test (χη2). The effect size provides insight into the strength of the observed differences or associations: small – indicating minor and practically less significant differences; moderate – suggesting clear and potentially meaningful differences; and large – indicating significant differences.
The lowest average age of participants was in Belarus and Ukraine (19.1 and 20.6 years, respectively), potentially linked to an earlier initiation into higher education. Conversely, the highest average age is seen in Poland (24.5 years), with intermediate values recorded in Lithuania and Slovakia (21.1 and 22.9 years, respectively).
The female population predominates across all countries, especially in Lithuania (84.0%) and Ukraine (76.6%). The proportion of women in Poland was the lowest (62.1%), although they continue to dominate the sample (small effect: Cramer’s V=0.15). Undergraduate programs are the most prevalent in most nations, with Belarus achieving a staggering rate of 99.3%, followed by Slovakia at 95.4%. In Poland and Lithuania, the rates stand at 86.7% and 61.1%, respectively, while Ukraine showcases a relatively significant share of graduate students (33.7%), exhibiting a moderate effect (Cramer’s V=0.24).
The urban demographic is dominant in Belarus and Lithuania, whereas Poland and Slovakia show a higher percentage of individuals hailing from rural areas and small towns. This trend is echoed in the structural analysis of current residence, reflecting a large effect size (Cramer’s V=0.42).
The highest percentage of non-working students is found in Belarus (87.4%). In Poland, a relatively high percentage of individuals balancing work and study is noted (41.9%), as well as in Slovakia (36.5%) and Lithuania (33.8%), while Ukraine records 30.6%. The effect here is moderate (Cramer’s V=0.24). The sample is predominantly focused on medical disciplines (69.7% overall), with notably high proportions in Ukraine (85.3%), Lithuania (83.4%), and Slovakia (70.3%). The lowest representation of medical fields is recorded in Belarus (51.7%), marked by a moderate effect (Cramer’s V=0.26).
In Poland, the Catholic population is the largest (63.6%), while in Belarus, Orthodox Christianity is predominant (44.9%). In Ukraine, both Orthodox (37.1%) and Greek Catholic (24.7%) communities are notably present, demonstrating a large effect size (Cramer’s V=0.38). A significant proportion of individuals expressing religious indifference is reported in Slovakia (29.3%) and Lithuania (26.9%).
Contact with Individuals with Physical Disabilities: The highest frequencies of daily interactions (both visual and direct) are recorded in Ukraine (67.0%), contrasting sharply with Poland (30.8%) and Slovakia (29.5%). The differences between countries are statistically significant (χη2, p<0.001), displaying a large effect size (Cramer’s V=0.38).
Overall Attitude toward Individuals with Mobility Disabilities (Self-Assessment): Scores fluctuate within a limited range of 8.1-8.6 (Me=9; IQR 8-9), alongside statistically significant cross-country differences (H=112; p<0.001).
To construct national sociodemographic profiles, we conducted a detailed analysis of key demographic categories within each country. This enabled identification of both shared characteristics and country specific patterns among student respondents. Table 2 summarizes the principal features of the study populations, highlighting structural similarities and differences across countries.
Table 2
Characteristic features of the sociodemographic profile by country (individual and contextual characteristics in the socioecological framework)
Profiles of a respondent by country. Analytical summary
Lithuania (LT): The respondent group is predominantly female, urban, and enrolled in medical fields. The majority are single and studying only, with notably low daily contact with individuals with disabilities.
Belarus (BY): Characterized by the youngest median age and the highest share of Bachelor’s students. Most respondents are from urban backgrounds; almost nine out of ten study without concurrent employment. Orthodox Christianity predominates.
Poland (PL): Stands out with the oldest median age, lowest proportion of females, highest share of married students, prevalent rural upbringing, and the greatest proportion both studying and working. Catholicism dominates.
Slovakia (SK): Features a diverse urban/rural mix, a moderate share of medical students, and relatively high levels of both single status and partnerships.
Ukraine (UA): Notable for high urban representation, highest share of medical students, and the greatest proportion having daily contact with individuals with disabilities. The sample is predominantly single, with strong Orthodox and Greek Catholic affiliations.
These national profiles clarify structural patterns and unique traits within each country and provide a basis for interpreting subsequent analyses of empathy and intergroup differences.
Empathy skills and their significance in relationships with individuals with disabilities (KRE-II findings)
The comparative analysis identified significant intergroup differences across all five KRE-II empathy subscales, whereas the aggregated KRE-II index (sum score) remained broadly similar across countries (overall Me=56) (Table 3). This pattern suggests that national profiles differ more in the composition of empathy components than in overall empathic potential.
Table 3
Comparative analysis of empathy levels (KRE-II) across five countries and five empathy syndromes, organized with reference to socioecological levels (individual/interpersonal)
[i] Notes: Post-hoc comparisons: Dunn’s tests with Benjamini-Hochberg adjustment (two-tailed, α=0.05); I. Sympathizing: BY<SK, UA, LT; LT<PL, SK; PL<SK, UA; SK<UA; II. Co-suffering: BY<PL, SK, UA; LT<PL, UA; PL<UA; SK<UA; III. Sensitivity: BY<PL, SK, LT; LT<UA; PL<UA; SK<UA; IV. Readiness: BY<PL, SK, UA, LT; LT<PL, SK, UA; V. Pure Empathy: BY<SK, LT; LT<PL, SK, UA; PL<SK, UA; SK<UA; KRE-II Index: LT<UA; PL<UA; SK<UA. Results are reported as Mean (SD) (Median). Kruskal-Wallis test used for omnibus comparisons. Abbreviations: BY – Belarus; PL – Poland; SK – Slovakia; UA – Ukraine; LT – Lithuania.
Analytical summary
Empathy Structure: Statistically significant intergroup differences were observed for all KRE-II empathy subscales (all p<0.001, Kruskal-Wallis test), although the overall KRE-II total scores are similar (median = 56) across countries.
Subscale Variation: The largest differentiation is observed in “Readiness to Sacrifice for Others” and “Sympathizing with Others’ Experiences”. Ukrainian respondents typically score highest on most subscales according to post hoc tests.
This pattern suggests meaningful cross-country variation across the five KRE-II subscales – from sympathy and emotional resonance to sensitivity, readiness to help, and perspective-taking. In the following sections, we therefore interpret these differences within the Social Ecological Model, linking individual-level empathy profiles to interpersonal contact, institutional practices, and broader sociopolitical contexts in each country.
Aggregated Empathy: Despite differences across subscales, the aggregated KRE-II Index shows only moderate variation, suggesting overall empathy levels are broadly comparable between countries.
Implications: These findings underline the importance of distinguishing between empathy dimensions in cross-cultural research: the profile, not just the total score, varies by sociocultural context, which may have practical significance for the effectiveness of support and inclusion practices.
Syndromic perspective of empathy profiles: cross-country patterns and interpretative considerations
Syndrome I. Median values are relatively close across countries, yet post hoc pairwise comparisons confirm significant differences (p<0.001), indicating variation in emotional responsiveness and readiness to be present with others.
Syndrome II. Scores are comparatively consistent, implying a broadly similar capacity for affective resonance and emotional attunement across student populations.
Syndrome III. The highest scores were observed in Poland and Lithuania, suggesting greater attentiveness and receptivity to others’ emotional signals among these groups.
Syndrome IV. Ukrainian students scored highest, implying a stronger propensity for prosocial, support-oriented action compared with other groups.
Syndrome V. Significant cross-country differences were detected (Kruskal-Wallis H=117, p<0.001). Post hoc comparisons indicated that Lithuania scored lower than Poland, Slovakia, and Ukraine; Belarus scored lower than Slovakia and Lithuania. Taken together with the patterns observed for Subscales I-IV, these findings indicate that countries differ not only in overall empathy scores but also in their specific profiles across sympathy, emotional resonance, sensitivity, readiness to help, and perspective-taking, which we further interpret within a social-ecological (SEM) framework. These results align with Table 3 and underscore that accuracy-focused, perspective-taking aspects of empathy vary across contexts.
Conceptual note
It is critical to differentiate “sympathizing” (Syndrome I) from true “empathic understanding” (Syndrome V). Sympathizing tends to involve referencing or sharing one’s own experiences (“being with”), whereas empathy (as measured by Syndrome V) prioritizes accurate, attuned insight into another person’s perspective and emotions, reflecting a qualitative depth of understanding.
Consequently, in interpreting cross-country empathy profiles, distinctions must be drawn between declarative willingness for presence (“sympathy”) and perceptual-cognitive attunement (“empathy”), as these dimensions have differing practical implications for communication and support in inclusive contexts.
The obtained results reveal certain differences in empathy profiles between students from different countries. Due to the varying number of statements present in each subscale, the values of these indicators were standardized by dividing the total points by the number of items constituting each syndrome. This standardization enabled a comparative analysis of the results across the scales, which are illustrated in Figure 1 (where 0 represents the lowest value and 3 indicates the highest value of the indicator).
Figure 1
Standardized median score (0-3) for KRE-II syndromes I-V by country (Belarus [BY], Poland [PL], Slovakia [SK], Ukraine [UA], Lithuania [LT], and overall [Total])
Notes: Error bars represent interquartile range (IQR). Higher medians for Syndrome IV (Readiness to Sacrifice) were observed in Ukraine.
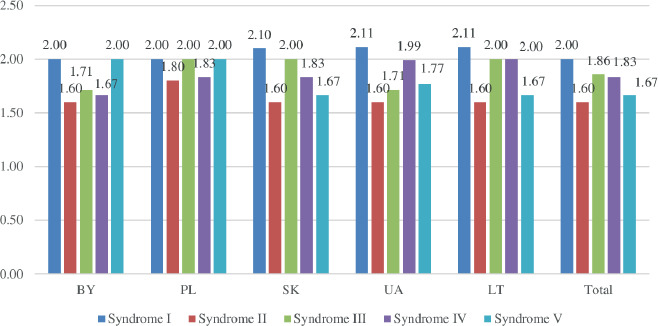
The highest median scores were observed for Syndrome I (Sympathizing) and Syndrome III (Sensitivity), whereas the lowest medians were recorded for Syndromes II (Co-suffering) and V (Empathy toward Others’ States and Experiences, hereafter referred to as Pure Empathy). Cross-national differences were most pronounced for Syndrome IV (Readiness to Sacrifice), with Ukrainian students demonstrating the highest median values. Overall, we interpret these cross-country patterns within a social-ecological framework, viewing empathy as shaped by individual, interpersonal, institutional, and societal factors. The median profiles across countries form a coherent pattern: Syndromes I and III tend to rank highest, while Syndromes II and V typically fall within the 1.6-1.8 range on the standardized 0-3 scale. Notably, “Sympathizing” (Syndrome I) reflects sharing one’s analogous experiences and emotional presence, whereas “Pure Empathy” (Syndrome V) prioritizes accurate, other-focused understanding. Higher scores on Sympathizing do not necessarily co-occur with higher “Pure Empathy”, indicating partial decoupling between “being with” others and perspective-taking accuracy. This distinction has practical implications for training. Rather than treating “empathy” as a single, undifferentiated target, training programs should address affiliative-affective components (e.g. “Sympathizing”, “Sensitivity”, “Readiness to Sacrifice”) and accuracy-focused perspective-taking (“Pure Empathy”) through distinct but coordinated pedagogical strategies. In our view, sympathy should not be increased indiscriminately as a proxy for empathy; instead, it should be critically reflected upon and harnessed as a motivational resource, while the primary target of “empathy training” remains accurate, other-focused understanding. This interpretation is consistent with arguments from Disability Studies. Scholars such as Shakespeare, Oliver, Siebers, Garland-Thomson, and Hughes have cautioned that sympathy, especially when experienced as pity, othering, or paternalistic concern, can reproduce power imbalances between disabled and non-disabled people. In contrast, the forms of empathy that are valued in Disability Studies emphasize cognitive attunement to disabled people’s lived experiences, respect for autonomy, and non-paternalistic support. In this sense, only “Pure Empathy” (Syndrome V) aligns with the kind of perspective-taking that Disability Studies scholars describe as desirable, whereas uncritical attempts to increase “Sympathizing” (Syndrome I) risk reinforcing unequal relations, even when motivated by benevolence.
Among the studied populations, the Ukrainian group exhibits the highest medians for Syndrome I (“Sympathizing”) and Syndrome IV (“Readiness to Sacrifice”), alongside strong results for Syndrome III (“Sensitivity”). Relatively lower values were recorded for Syndromes II (Co-suffering) and V (“Pure Empathy”), remaining within a moderate range comparable to other countries. Consistent with prior literature, higher scores on “Sensitivity” (III) and “Readiness to Sacrifice” (IV) are often linked to more inclusive behavioral intentions; where data were available, lower negative emotional arousal appeared to align with stronger intentiontoaction links. In the present study, these mechanisms should be regarded as theoretically grounded interpretations unless supported by dedicated analyses.
Table 4 provides convergent evidence that “Sensitivity” (III) and “Readiness to Sacrifice” (IV) are most tightly connected to the total KREII (ρ=0.788 and 0.753, respectively), closely followed by “Co-suffering” (II; ρ=0.752). While “Sympathizing” (I) and “Pure Empathy” (V) also correlate positively with the total index (ρ=0.562 and 0.670), cross-country profiles indicate partial decoupling between “being with” (I) and accuracy-focused empathic understanding (V), supporting the need to address these components separately in training and program design. Notably, while Syndromes I (Sympathizing) and V (Pure Empathy) also correlate positively with the total index (ρ=0.562 and ρ=0.670), observed cross-country profiles indicate that high sympathizing does not necessarily coincide with higher “pure” empathic understanding, underscoring the need to address these components separately in training programs.
Table 4
Spearman’s rank correlations (ρ) among KRE-II empathy syndromes and KRE-II total (all p<0.05)
| Variable: Syndrome | I | II | III | IV | V | KRE-II total |
|---|---|---|---|---|---|---|
| I | 1.000 | - | - | - | - | - |
| II | 0.313 | 1.000 | - | - | - | - |
| III | 0.382 | 0.573 | 1.000 | - | - | - |
| IV | 0.316 | 0.501 | 0.598 | 1.000 | - | - |
| V | 0.207 | 0.356 | 0.348 | 0.357 | 1.000 | - |
| KRE-II total | 0.562 | 0.752 | 0.788 | 0.753 | 0.670 | 1.000 |
The Spearman’s rank correlations reveal a coherent pattern of interdependencies within the KREII scale. The components most strongly associated with the overall empathy score are “Sensitivity to Others’ Experiences” (Syndrome III) and “Readiness to Sacrifice for Others” (Syndrome IV), with ρ=0.788 and ρ=0.753, respectively; “Co-suffering” (Syndrome II) is comparably strong (ρ=0.752). This pattern underscores the centrality of perceptual-affective attunement (III) and action-oriented prosocial motivation (IV), together with affective resonance (II), in shaping the holistic empathy profile. A relatively strong inter-component correlation between II and III (ρ=0.573) further suggests that co-experiencing others’ affect is closely linked with heightened sensitivity to emotional signals.
From a comparative standpoint, Syndromes III and IV show the strongest associations with the KRE-II total, while Syndrome V (“Empathy toward Others’ States and Experiences” (Pure Empathy) demonstrates moderately high associations (ρ=0.670) relative to the other components. Consistent with cross-country profiles reported above, elevated scores on “Readiness to Sacrifice” (IV), particularly notable in the Ukrainian group, and present to a degree in the Lithuanian and Slovakian groups, may indicate greater readiness to translate empathic resources into pro-inclusive behaviors; this interpretation is strengthened when considered alongside evidence of lower emotional burden, where available. Overall, the empathy level can be characterized as moderately high, driven primarily by components I, III, and IV; at the same time, scores on the more fine-grained, accuracy-focused components, “Co-suffering” (II) and “Pure Empathy” (V), tend to remain in the mid-range, delineating a priority area for targeted developmental interventions.
Discussion
This study provides a comprehensive, syndromic assessment, and cross-national comparison of empathy (KRE-II) among a large international sample of university students from Poland, Lithuania, Belarus, Ukraine, and Slovakia – societies situated along the eastern border of the European Union and currently exposed to warfare-related crises. The use of a multicenter design, validated measurement tools, and a coherent theoretical framework supports the reliability, generalizability, and practical relevance of the findings, particularly for pro-inclusion policies and higher-education interventions [3-5, 36-39].
From a cross-sectional perspective, empathy remains a salient social resource among young adults, although it exhibits clear cross-country variation in its syndromic profile [36]. Standardized median scores indicate that “Sympathizing” (Syndrome I) and “Sensitivity to Others’ Experiences” (Syndrome III) tend to rank highest, while “Co-suffering” (Syndrome II) and “Pure Empathy” (Syndrome V) typically fall within the mid-range (about 1.6-1.8 on the 0-3 scale). This pattern suggests that, across the CEE societies, empathic reactions are more often expressed as sharing of one’s own analogous experiences than as precise adoption of another person’s perspective-consistent with prior research on intercultural and interpersonal competencies [4,5,10,40,41].
Correlation patterns (Table 4) demonstrate that “Sensitivity” (III) and “Readiness to Sacrifice” (IV) are the strongest contributors to overall empathy (ρ=0.79 and 0.75, respectively), followed closely by Co-suffering (II; ρ=0.75). This emphasizes the centrality of perceptual-affective attunement and prosocial motivation in the empathy construct.
Variability in empathy and preferred support strategies appears to be shaped not only by individual characteristics (e.g. empathy profile, contact experience) but also by academic environments, institutional norms, and broader sociocultural contexts – such as disability visibility, accessibility of services, and prevailing beliefs and stereotypes [42,43]. A key contribution of this study is the simultaneous consideration of the quality and frequency of contact as mechanisms of change, embedded within a multi-level framework (individual, relational, institutional, sociocultural). These findings are best understood within the SEM, a multi-level framework spanning individual, relational, institutional, and sociocultural (policy) domains. This approach helps identify pathways through which empathy supports inclusion [3,5,44,45].
Between-country differences in empathy structure are noteworthy. Higher “Readiness to Sacrifice” (IV) among Ukrainian students and increased “Sensitivity” (III) among Polish and Lithuanian students may reflect differences in societal context, intensity and quality of contact with people with disabilities, and experiences of ongoing crisis, including military conflict and related social transformations [46,47]. These findings may suggest both strengthened solidarity under adversity and a dual effect of war: enhanced disability visibility and activation of empathic resources, paired with the psychosocial strain that may limit sustained prosocial engagement [14,48,49]. Social desirability, prior trauma, and continuing exposure to crisis conditions could also partially account for these outcomes [47,50,51].
While the results are consistent with studies on the positive effects of contact and heightened empathy during crises [50], the cross-sectional design precludes causal inference. Although patterns observed in Ukraine support hypotheses regarding war-related impacts on disability visibility and attitudes, no direct measure of exposure was included; interpretation of these effects should therefore remain tentative.
Cross-national variations in empathy are unlikely to represent random noise – they plausibly reflect real differences in cultural norms, institutional practices, and educational pathways, as well as in what can be termed contact infrastructure. Here, “contact infrastructure” denotes the institutional, organizational, and spatial conditions that enable frequent, authentic interactions and collaboration with people with disabilities (e.g. inclusive campus design, curricular or service-learning opportunities, and accessible communication channels).
These findings align with the social model of disability, which frames inclusion and belonging, not mere coexistence, as the ultimate outcomes of social and educational interventions [28,29,43]. Accordingly, effective strategies should integrate: Individual development, strengthening empathic competencies such as “Sensitivity”, “Perspective-taking” accuracy, and prosocial readiness; and systemic change, improving educational environments through inclusive design, volunteering and mentorship programs, digital accessibility, and sustained institutional commitment to equity and participation [37].
The practical implications are considerable for both higher-education programming and public policy, particularly within multicultural, border, and crisis-exposed contexts [44]. Priority areas include enhancing “Sensitivity” (III) and “Readiness to Sacrifice” (IV), improving “Perspective-taking” and “Pure Empathy” (V), developing skills for identifying needs, and investing in robust contact infrastructure.
Empathy, when supported institutionally and socially, acts as a driver of solidarity, cooperation, and community cohesion, key resources for resilience in Central and Eastern European societies facing geopolitical and humanitarian challenges.
Future studies should employ longitudinal and mixed-method designs to track changes in empathy over time, incorporate direct indicators of war or crisis exposure, and examine how empathic resources translate into sustained pro-inclusive behaviors within academic and broader social contexts.
Limitations
This study has several limitations. First, its cross-sectional design precludes any causal interpretation of the observed associations. Second, war-related exposure was not assessed using validated individual-level indicators but was instead inferred from country context and participants’ self-reports, which may introduce ecological fallacy and residual confounding. Third, the reliance on self-report instruments raises the possibility of social desirability bias and recall effects. Unmeasured or uncontrolled factors – such as personal trauma history, institutional environment, or variability in access to support services – may also contribute to differences between groups. Therefore, any moderation effects attributed to conflict exposure should be interpreted as associative rather than causal.
Future research should address these limitations by using longitudinal or mixed-method designs, incorporating validated multilevel measures of conflict exposure, and systematically assessing contextual and institutional moderators. Such approaches would enable stronger causal inference and a more comprehensive understanding of empathy dynamics in crisis-affected educational settings.
Conclusions
This study offers a syndromic, cross-national assessment of empathy among university students in Central and Eastern Europe, situating the findings within broader social and geopolitical contexts and explicitly highlighting the role of interpersonal contact.
Differentiated empathy profile. Across all countries, students scored highest on “Sympathizing” (I) and “Sensitivity” (III) and lowest on “Co-suffering” (II) and “Pure Empathy” (V). The most frequent empathic response involved sharing analogous experiences rather than deeply adopting another’s perspective.
Cross-national differences. Ukrainian students demonstrated the highest “Readiness to Sacrifice” (IV), while students from Poland and Lithuania scored higher on “Sensitivity” (III). These differences likely reflect variations in contact opportunities, institutional environments, and crisis-related experiences, yet they should be interpreted as associative rather than causal.
Implications for inclusion. Effective inclusion of students with mobility disabilities requires the intentional development of empathic competencies – especially “Sensitivity” (III), “Readiness to Sacrifice” (IV), and perspective-taking accuracy within “Pure Empathy” (V) – as well as investment in institutional contact infrastructure that fosters frequent, authentic, and cooperative interactions. Aligning educational practices, campus accessibility, and support systems can help translate empathic potential into sustainable pro-inclusive action and enhanced well-being within the academic community.